
Make the path clear.
Set requirements early, coordinate reviews and give timely answers. Reuse sound studies where they still apply.
A future here
A home we can afford. Enough left to live.
As a parent, I worry about our children working hard and still being unable to afford a place of their own. I want staying in Campbell River to be a real option.
Start with the household budget
01 · The household
Incomes grew. Home prices grew much faster. That makes the first step into a home a longer reach.
$136,787 → $537,494
$52,800 → $92,100 a year, before tax
Home prices are annual single-family sales averages. Income is the household average before tax. This is a historical comparison, not a mortgage affordability calculation.
The bars use the same zero baseline and percentage scale. Prices cover VIREB's Campbell River sales area; incomes cover households inside the city. Those boundaries differ. All amounts are nominal dollars, with no inflation adjustment.
2020 is the latest household-income year used here, from the 2021 Census. We have not invented a newer income figure. Average annual sale prices subsequently reached $744,314 in 2025, but that later price is not compared with 2020 income.
Detailed housing sources and methodologySee the five-year observationsRent or a mortgage is only the beginning of the costs a household is dealing with. Property taxes, utilities, groceries and transportation are also squeezing budgets.
02 · The homes
A housing needs assessment estimates how many homes a community needs. The next question is whether enough homes make it from a plan to a place someone can live.
Illustration. Building totals are examples.
In 2021, the report estimates a shortage of 1,791 homes. Zero means no additional homes counted yet, not no homes in the city.
The shortage we start with
2021 to 2026 · 30 seconds
We begin with a shortage. January 2021 illustration: 0 example homes added since 2021, 1,791 total homes needed, 1,791 still needed. In 2021, the report estimates a shortage of 1,791 homes. Zero means no additional homes counted yet, not no homes in the city.
Where the numbers come fromThe report starts with an estimated shortage of about 1,800 homes. As more households need a place to live, building has to catch up with that growth before it can reduce the shortage we began with.
The animation explains that relationship using example building totals. To show actual progress, we need a consistent count of homes completed, less homes lost, within the city. Their price, size and accessibility matter too.
The January 2025 Interim Housing Needs Report uses 2021 as its starting year. Table 9 gives a subtotal of 1,791 homes across four kinds of existing need: severe affordability or housing problems, homelessness, households unable to form, and a healthier rental vacancy rate. That is the basis for the opening gap shown here.
These are modeled needs for suitable, affordable homes. They are not a count of empty lots or missing buildings. The individually rounded components add to 1,792; we retain the report's stated subtotal of 1,791 and describe it as about 1,800.
The report identifies another 1,897 homes for anticipated household growth between 2021 and 2026. This illustration spreads that growth evenly across five years. Total need rises from 1,791 to 3,688. The years and movement show a simplified model based on the report, not annual measurements or a forecast of actual construction.
The report's official five-year planning total is 2,842 homes. It phases in part of the longer-term existing need and includes an additional local-demand allowance. Our illustration starts with the full existing-need subtotal, then adds household growth. It excludes the separate demand allowance. Adding the entire five-year target to the opening shortage would count some needs twice.
A completed home ready for use adds to the total. A home lost through demolition or another removal reduces it. Zero at the beginning means zero additional homes counted since that starting point. The city's existing homes are already part of the baseline.
The blue totals below are examples chosen to explain the movement. They are not Campbell River's observed results, permits or housing starts. They should be replaced only with verified completion and housing-loss records for the same City boundary and time period. Missing figures must never be treated as zero.
| Year | Modeled need | Example homes added | Example gap |
|---|---|---|---|
| 2021 | 1,791 | 0 | 1,791 |
| 2022 | 2,170 | 250 | 1,920 |
| 2023 | 2,550 | 550 | 2,000 |
| 2024 | 2,929 | 900 | 2,029 |
| 2025 | 3,309 | 1,300 | 2,009 |
| 2026 | 3,688 | 1,800 | 1,888 |
The two thermometers share a fixed scale of zero to 4,000 homes. Grey shows the starting shortage plus additional household need; blue shows example homes added since 2021. The shaded distance between their levels is the remaining gap. The numbers sit outside the thermometers so the movement stays visible.
Read the 2021 starting point, then press Play. The story moves continuously from 2021 to 2026 over 30 seconds, with no automatic stops at individual years or at the widest gap. The month and year change inside the chart as the gap moves from widening to narrowing. Pause stops in place; Resume continues from there, and Start over returns to the opening explanation. The final result stays visible. The January-to-January calendar is a reading aid for the five-year model, not monthly construction data. Intermediate values simply connect the annual figures. When your device requests reduced motion, the display advances in monthly steps without the calendar animation.
A comparable City-wide series of completions and housing losses. The public CMHC Campbell River completion series stops after 2022 and uses a wider census area. Its current survey methodology collects completions in census metropolitan areas. Permit totals cannot stand in for finished homes.
A shrinking quantity gap would still need a closer look: homes must also meet people's needs for affordability, size, accessibility and support. The illustration does not assign results to a particular policy or Council.
Sources checked September 15, 2026. The 2025 report is applied retrospectively to its 2021 baseline. The construction path remains illustrative.
03 · The balance
There are a lot of protections in place for the things we care about, like the environment. We also need homes people can afford. I want us to look carefully at how those priorities balance out.
That means understanding what a requirement protects, what it costs, and whether we can achieve the same benefit in a simpler way. The cost of waiting matters. So does the long-term value of a safe, well-built home.
Set requirements early, coordinate reviews and give timely answers. Reuse sound studies where they still apply.
Weigh purchase costs, City charges and ongoing bills alongside safety, environmental protection and long-term savings.
Show what gets approved, what gets built and who it serves. Use that information to see where the process needs to improve.
My involvement with the Campbell River Head Injury Support Society has shown me why a suitable home and support belong together. I want the City to work with local non-profits that understand the people they serve, and help them get through the obstacles to providing homes.
The Society’s housing work ↗Council cannot control interest rates or waive provincial law. We can improve our own processes, plan the infrastructure homes need, and press for requirements that deliver value for the people who pay.
A closer look at the Energy Step Code
Energy savings come later.
The extra purchase cost comes first.
Circle area shows the cost premium. The scale stays fixed as you change homes.
Modelled premiums over the 2018 code baseline.
Not additional costs above today’s Step 3 minimum.
Climate Zone 5. Ten lowest-cost simulations per case.
Evoke/e3 study, 2022, pp. 105–106 ↗
Fixed equipment costs weigh more heavily on small homes. Complicated forms also cost more to make efficient. The study found that increasing surface area relative to floor area by 50% roughly doubled compliance costs. Shared walls and simpler designs can help.
Study, pp. 106 and 114 ↗The model largely uses early-2020 prices. Its 20-year financial analysis assumes a carbon price rising to $300 per tonne in 2040. BC eliminated its consumer carbon tax in April 2025. Those payback results need recalculation.
I want current local quotes, financing costs, maintenance and realistic utility savings shown together before supporting a higher local step. Long-term value and the ability to afford the purchase are different tests.
Study assumptions, pp. 34–37 ↗Current carbon-tax policy ↗Campbell River requires an energy model and advisor’s report before a Part 9 building permit, then an as-built compliance report before occupancy. Its bulletin recommends a mid-construction airtightness test. A late failure can mean remedial work before occupancy. No reliable local average for those extra costs or delays was found.
Campbell River requirements ↗Better envelopes can reduce energy demand and improve comfort. The Energy Step Code measures energy performance; the Zero Carbon Step Code addresses operational emissions. An electrification cost should not automatically be attributed to the Energy Step Code.
The chart is a construction model, not a survey of completed homes. It does not establish a present-day net cost for a Campbell River buyer.
Province’s guide to both codes ↗Step 3 baseline requirements ↗For a closer read
The costs, the delays, the evidence.
Protected archaeological sites can exist on private land even when they have not been recorded. Investigation, permits and an unexpected discovery can interrupt ground work or require a different building footprint. Without the required permission, work affecting a protected site cannot proceed.
The Province’s 2023 housing engagement report records participants describing waits of up to a year for archaeological permits. This is reported experience, not a measured average. No defensible province-wide cost per home was found.
I want early information and timely decisions, with First Nations involved early. The Province itself identifies multiple permits, long delays and high costs as reasons for reform. Its proposed single-project permit is a proposal, not an existing exemption.
Current Act ↗2023 engagement report ↗Province’s reform objectives ↗The Water Sustainability Act can require a change approval for stream work. Specified lower-risk work can follow a notification process instead. The 45 days is a notice period, not an average approval backlog. Technical studies, conditions and project redesign can add costs.
A proposal needing approval cannot proceed without it. No reliable residential cost per home was found. Conditional exemptions introduced in February 2026 cover some construction dewatering, so not every such activity needs a licence.
Provincial approval and notification guidance ↗2026 amendments ↗Coquitlam’s March 2022 guidance, p. 7. Historical estimates, not current Campbell River quotes. Surveys and other specialists can add more.
The Riparian Areas Protection Regulation can require a qualified professional’s assessment and leave part of a site unavailable for new buildings. The 30-metre assessment area is not an automatic 30-metre building ban; the protected area depends on the applicable assessment and rules. Lost building area and repeated studies can matter more than the initial report fee.
Amendments scheduled for January 1, 2027 will change some requirements. Their effect on actual costs and processing times remains to be seen.
Municipal cost and timing guide ↗Current regulation ↗Scheduled changes ↗A provincial study of 2024-code seismic and adaptability changes found widely different costs by location and building design. This range is from its five six-storey wood-frame models, using first-quarter 2025 Vancouver rates.
Do not treat this as a current Campbell River premium. The study assumed 100% adaptable dwellings; the adopted requirement is 20% in covered apartment and condominium buildings. These are conceptual estimates, with stated accuracy of ±25%. Campbell River was not modelled.
Stronger structures and accessible homes have real value. More material, engineering and space can also change project feasibility. I want the Province to publish costs for the rules it actually adopted, including the effect on smaller and less expensive homes.
2025 study, BTY summary table ↗Adopted accessibility requirements ↗BC Housing fees. Warranty insurance is additional.
The cost starts before the first home. New Part 9 general contractor applicants generally need 24 months of relevant management or supervision experience within five years, plus seven competency areas. Recognized prior learning can replace courses. General contractors must also meet a 20-point continuing education requirement each licence year.
Warranty providers have a separate acceptance process. Renewal charges can add to annual overhead, alongside per-home premiums, technical reports and possible security deposits. Terms vary. Security ties up capital; it is not all a consumed fee.
These hurdles can discourage people from becoming builders. Fixed costs weigh more heavily on someone building one or two homes a year. That is an economic inference; no reliable estimate of how many builders are deterred was found.
Without licensing and warranty acceptance, a project generally cannot proceed through the standard route, subject to exemptions. Warranty protects buyers against defects. I want that protection delivered with a proportionate path for capable small builders to qualify.
Also payable: $40 per home in registration licensing fees and a $750 per-unit reconstruction levy for applicable coastal multi-unit buildings. Provider renewal and security requirements are documented in National’s 2026 BC guide; renewal charges appear in a publicly filed WBI agreement dated 2021. Neither establishes a current province-wide insurer fee.
Initial licence fee ↗Annual licence renewal ↗Experience and competencies ↗Prior learning pathway ↗Annual continuing education ↗National: renewal and security ↗WBI: renewal charges, 2021 agreement ↗Per-home registration fees and exemptions ↗Insurer acceptance and project requirements ↗Different years, places and buildings. These figures cannot be added into a single cost per home.
Follow the numbers
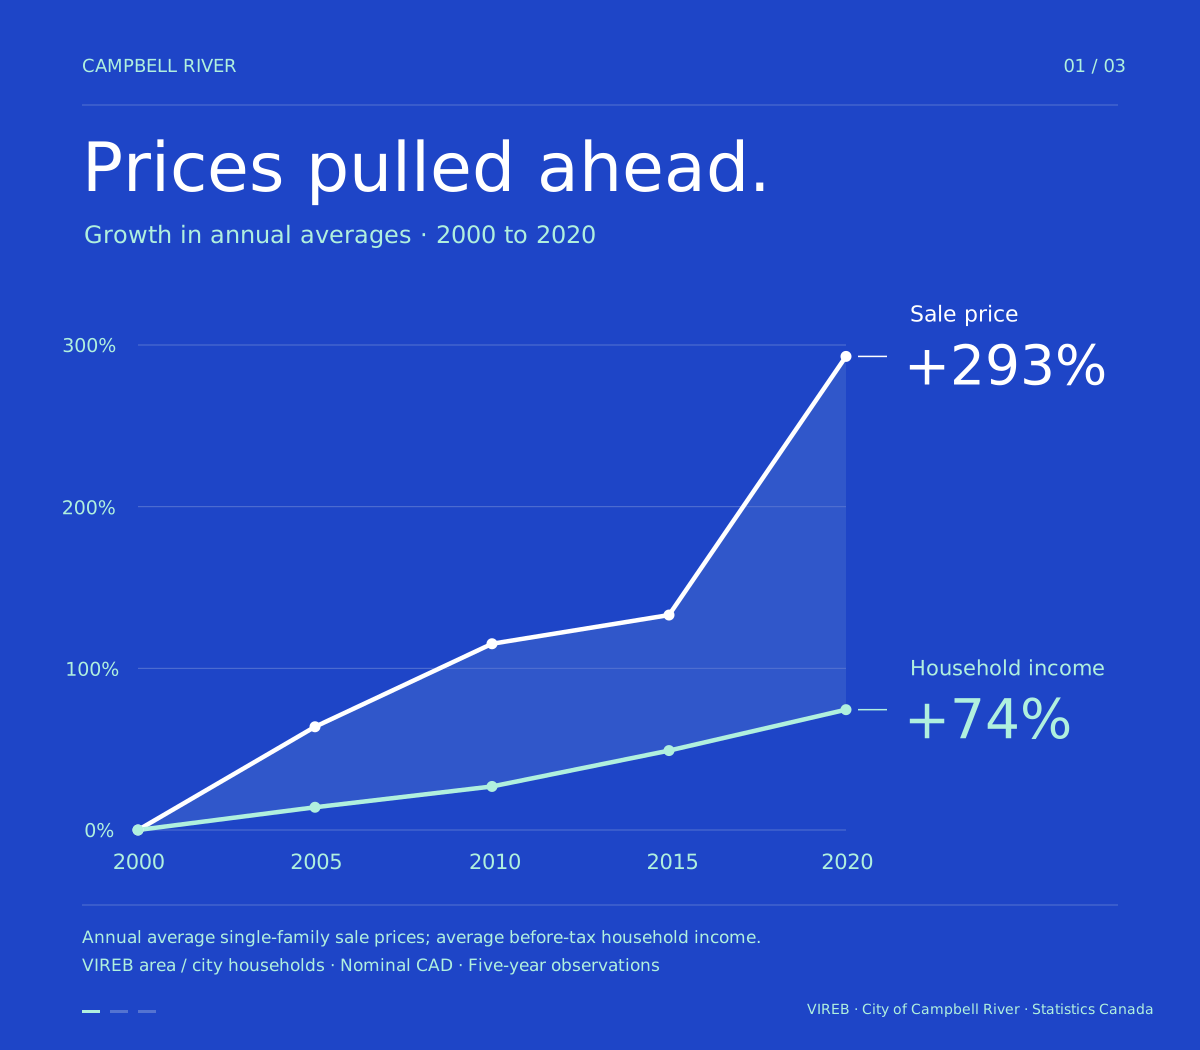
Between 2000 and 2020, average home prices rose 293%, from $136,787 to $537,494. Average household income rose 74%, from $52,800 to $92,100.
The latest household income observation used is 2020, reported in the 2021 Census.
Open full-size chart ↗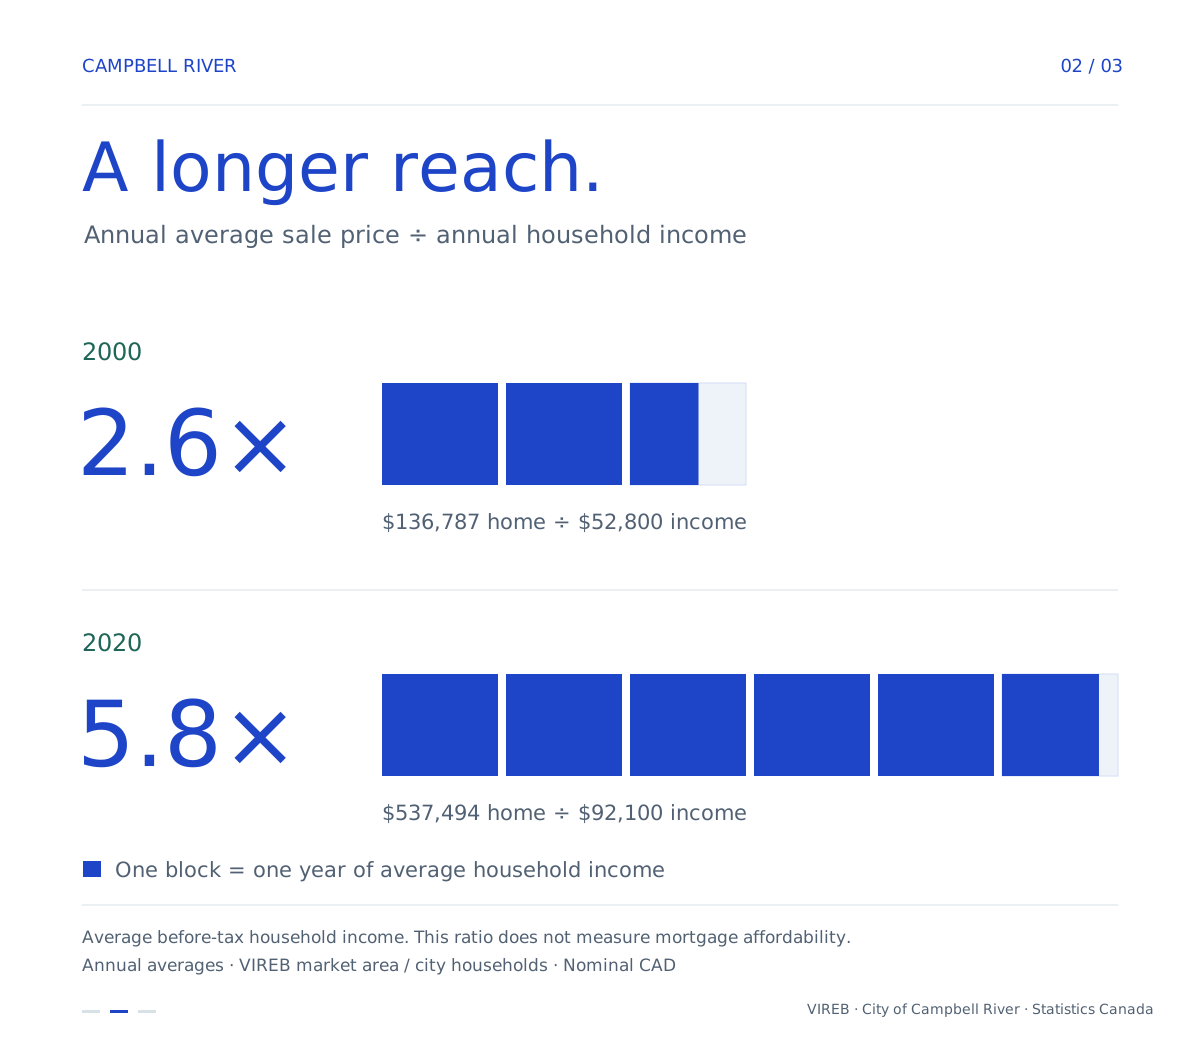
Average home price was 2.6 times average annual household income in 2000 and 5.8 times in 2020.
An indicative price-to-income comparison, not a mortgage qualification or affordability test.
Open full-size chart ↗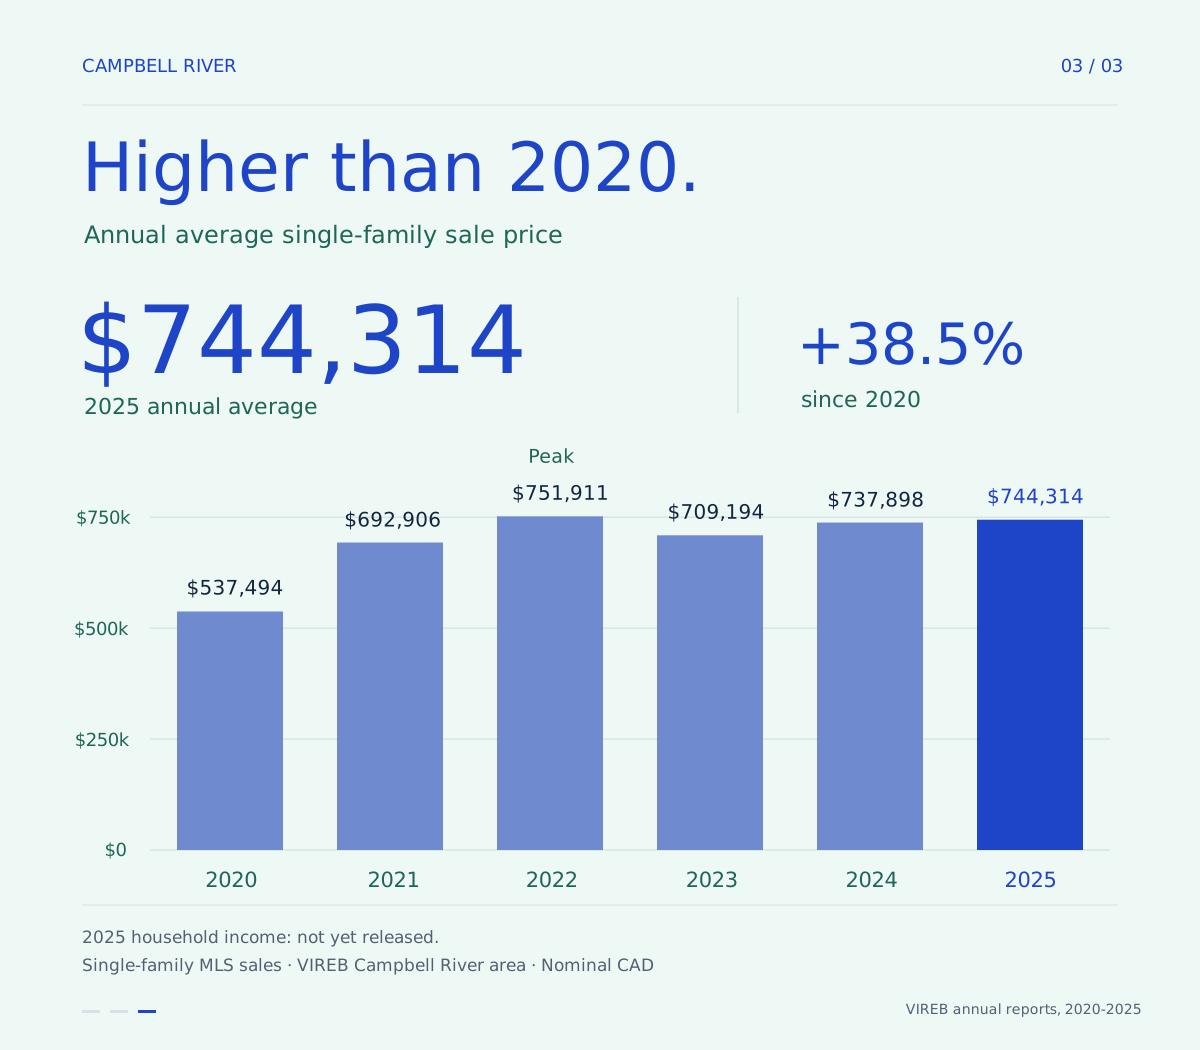
Average single-family sale prices: 2020 $537,494; 2021 $692,906; 2022 $751,911; 2023 $709,194; 2024 $737,898; 2025 $744,314. Prices rose 38% between 2020 and 2025.
Annual sales averages. No 2025 household income has been estimated.
Open full-size chart ↗Home prices use VIREB annual single-family MLS sales averages for its Campbell River zone. Recent reports exclude acreage and waterfront. Household income is the mean total annual income before tax for private households in the Campbell River census subdivision. Geography and definitions differ; all dollars are nominal.
These charts use annual average sale prices. An average reflects the homes sold during a period; a benchmark estimates the price of a typical home. VIREB publishes both measures. To keep comparisons consistent, the charts follow the annual-average series throughout.
VIREB: benchmark p. 6; annual average p. 13 ↗Detailed housing sources and methodology ↗Research checked September 12, 2026; warranty section updated September 13. Figures are rounded where shown.